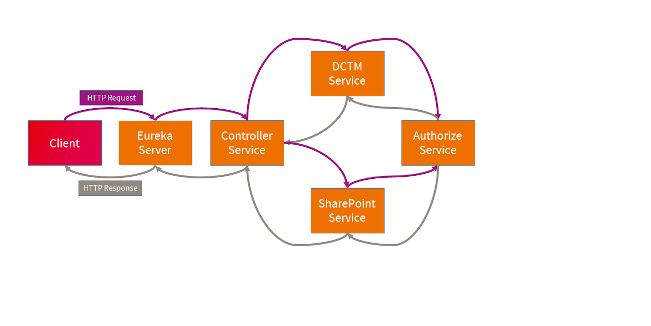
Microservice architectures are often a graph of components distributed across a network. This architecture gives rise to a new problem. How can we trace and bind together all services involved in one operation request? When a client calls an operation, it can be spread across different services over the network, each service has its own context.
For example, how can we detect a bottleneck? How can we identify the duration of a specific call inside a greater operation request involving multiple services?

Traditional tools such as logging and profiling can only collect data of a specific service context. Microservices can be created and destroyed on demand, making it difficult to look for a specific log. If we want to have a view of the whole picture, we need something else.
Distributed Tracing
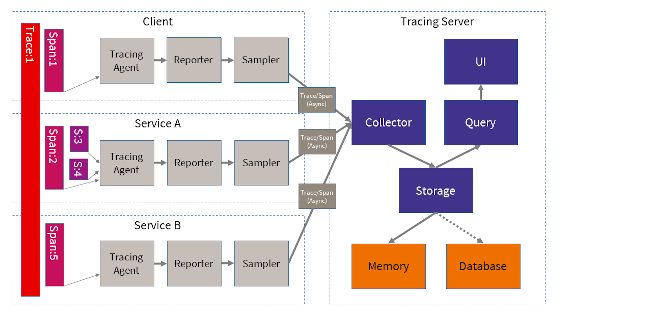
Here’s where Distributed Tracing comes in. Distributed tracing is a technology that shares trace data between calls of different services. The system generates one root trace ID on the first request, then for each subsequent request, it generates a new span related to the root trace ID. Enabled systems report tracing data to a centralized collector, which clusters related traces together and saves them in storage (memory or database). Using a UI makes it possible to view a timeline of the overall picture for each operation. Completed traces are reported asynchronously to reduce overhead. If desired, a tracing server can run in a Docker container.

Modifying a system to use distributed tracing is very simple. We just need to configure the tracing agent with a reporter that points to the tracing server. Highly intensive systems can be configured to collect just a sample of the tracings. If the context already has a trace ID, the tracing agent will use it; if not, it will create a new root trace ID. This trace ID forms the overall bracket for the compound action. The tracing agent is responsible for extracting the tracing data from the context and injecting it, before a call, into the next request. Each request will create a new span related to the same root trace ID. If necessary, the system can create new sub spans (to characterize a subroutine, for example). The system can use the span to annotate events (timestamps) and tags (key/value pairs).
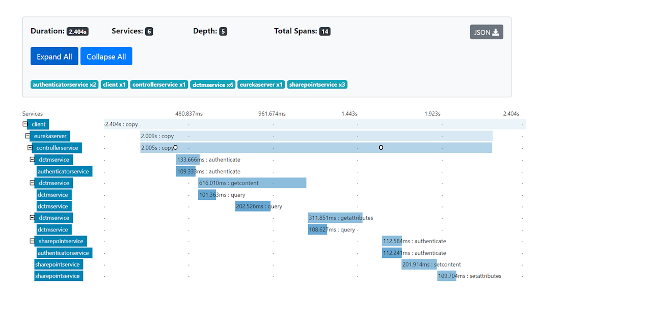
In the UI, we can see a timeline of each span from a specific trace ID. Each line represents a span generated by a service. We can see when each span started and ended (duration), its hierarchy, events (timestamps) and key/value pairs.

Go to market
Popular distributed tracing systems include Zipkin and Jaeger. Zipkin was originally created by Twitter and Jaeger was built by Uber. Nowadays, however, both are open source.
Both have similar architecture:
- run in a Docker container
- timeline UI
- query trace and span
- sampling
- storage types: Memor, Cassandra, ElasticSearch, MySQL
- client API in most common languages: C++, C#, Go, Java, Python, Ruby, Node.js, Scala, PHP
If you use Spring Cloud, you can use Spring Cloud Sleuth to integrate with Zipkin quite easily with some configurations and annotations. It automatically intercepts the incoming request and checks if there is a trace ID already. If not, it creates a new root trace ID. For outgoing requests, it fills the current trace data in the outgoing request. For finished spans, it asynchronously sends the trace data to the Zipkin server.
Integration in OpenText Documentum
Since these tracing concepts are an excellent way to collect tracing information originated from distinguished services, we might also want to use this technology to trace Documentum services which are in this case D2 HTTP requests and Server Method calls. With minor adjustments, almost everything can be integrated into such a tracing infrastructure in order to reveal potential bottlenecks or to get better insights into the application flow.
Bottom Line
Distributed tracing systems are used for monitoring and troubleshooting Microservices-based distributed systems. They allow us to see the whole picture and its hierarchical dependencies, no matter how many Microservices are involved. We can easily trace, debug and identify bottlenecks in a specific service.
The tracing servers are lightweight and can run in Docker containers. They collect trace data asynchronously minimizing the impact in our systems and they have an intuitive UI. They can save the trace data in memory or in an external database.
It is quite easy to enable our services with remote tracing regardless of which language we are using.
I really like the idea of consolidating tracing data in order to have a single view and to get better insights into nested calls (the application flow) and – from a developer’s perspective – to attach more information to this tracing data, which can be easily inspected via the Web UIs provided by the tracing servers.
Read also:


0 Comments