
Data Visualization in Virtual Reality has the potential to revolutionize how businesses, organizations, and individuals interact with information. As virtual reality technology becomes more accessible, its applications extend beyond gaming, and one area where VR can make a significant impact is data visualization.
During a hackathon organized by our team, we developed a prototype of a VR data visualization tool. This tool allows users to explore and interact with various datasets in a 3D environment, enabling them to gain deeper insights into the information they are analyzing.
Background and Context
As datasets grow increasingly complex and challenging to understand, the need for effective data visualization tools becomes crucial. Existing tools often rely on static 2D visualizations, which can limit the amount of information that can be presented and make it difficult to grasp the underlying patterns and trends. By leveraging VR, we can visualize multiple dimensions of data simultaneously, enhance the perception of patterns, and introduce a new sense of scale and perspective.
One of the major advantages of data visualization in virtual reality is the ability to immerse oneself in the data. Unlike traditional 2D visualizations, VR provides a sense of presence and spatial awareness, allowing users to navigate through the data and explore it from different angles. This immersive experience enhances the understanding of complex relationships and patterns that may not be apparent in traditional visualizations.
Another advantage is the ability to visualize data in multiple dimensions simultaneously. In VR, data can be represented as three-dimensional objects, with each axis representing a different variable or attribute. This enables users to grasp the relationships between variables more intuitively and identify correlations that may be overlooked in 2D visualizations.
VR data visualization also offers a new level of interactivity. Users can manipulate and interact with the data using natural gestures and movements, enhancing the sense of engagement and facilitating a deeper exploration of the data. For example, users can grab, rotate, and zoom in on data objects, providing a hands-on experience that promotes a better understanding of the underlying information.
Setting Up A Basic VR Graph Data
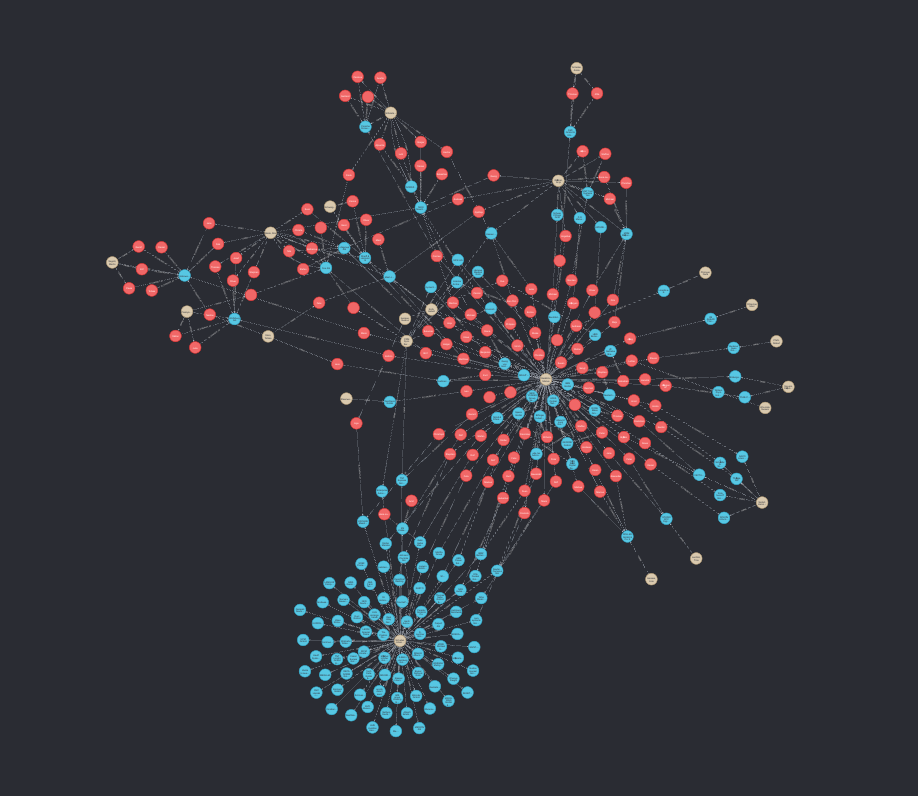
For our visualization we started by loading a simple dataset into a neo4j graph database. This allowed us to easily query the data and visualize it in a 3D environment. In our case we used a dataset of our customers and associated sales opportunities, as well as the corresponding contact persons in our CRM system. This allowed us to create a graph of customers, opportunities and contacts, which we could then visualize in VR.
Importing the data
With this data we can now start to visualize the graph.
Application
While researching different VR frameworks we came across the “3d-force-graph-vr” library, which is a web-based framework that allows you to create VR experiences using HTML and JavaScript. This made it easy for us to create a simple VR application that could be accessed through a web browser. This allowed us to quickly prototype our visualization and test on a desktop computer, before opening it up in the browser on a VR headset.
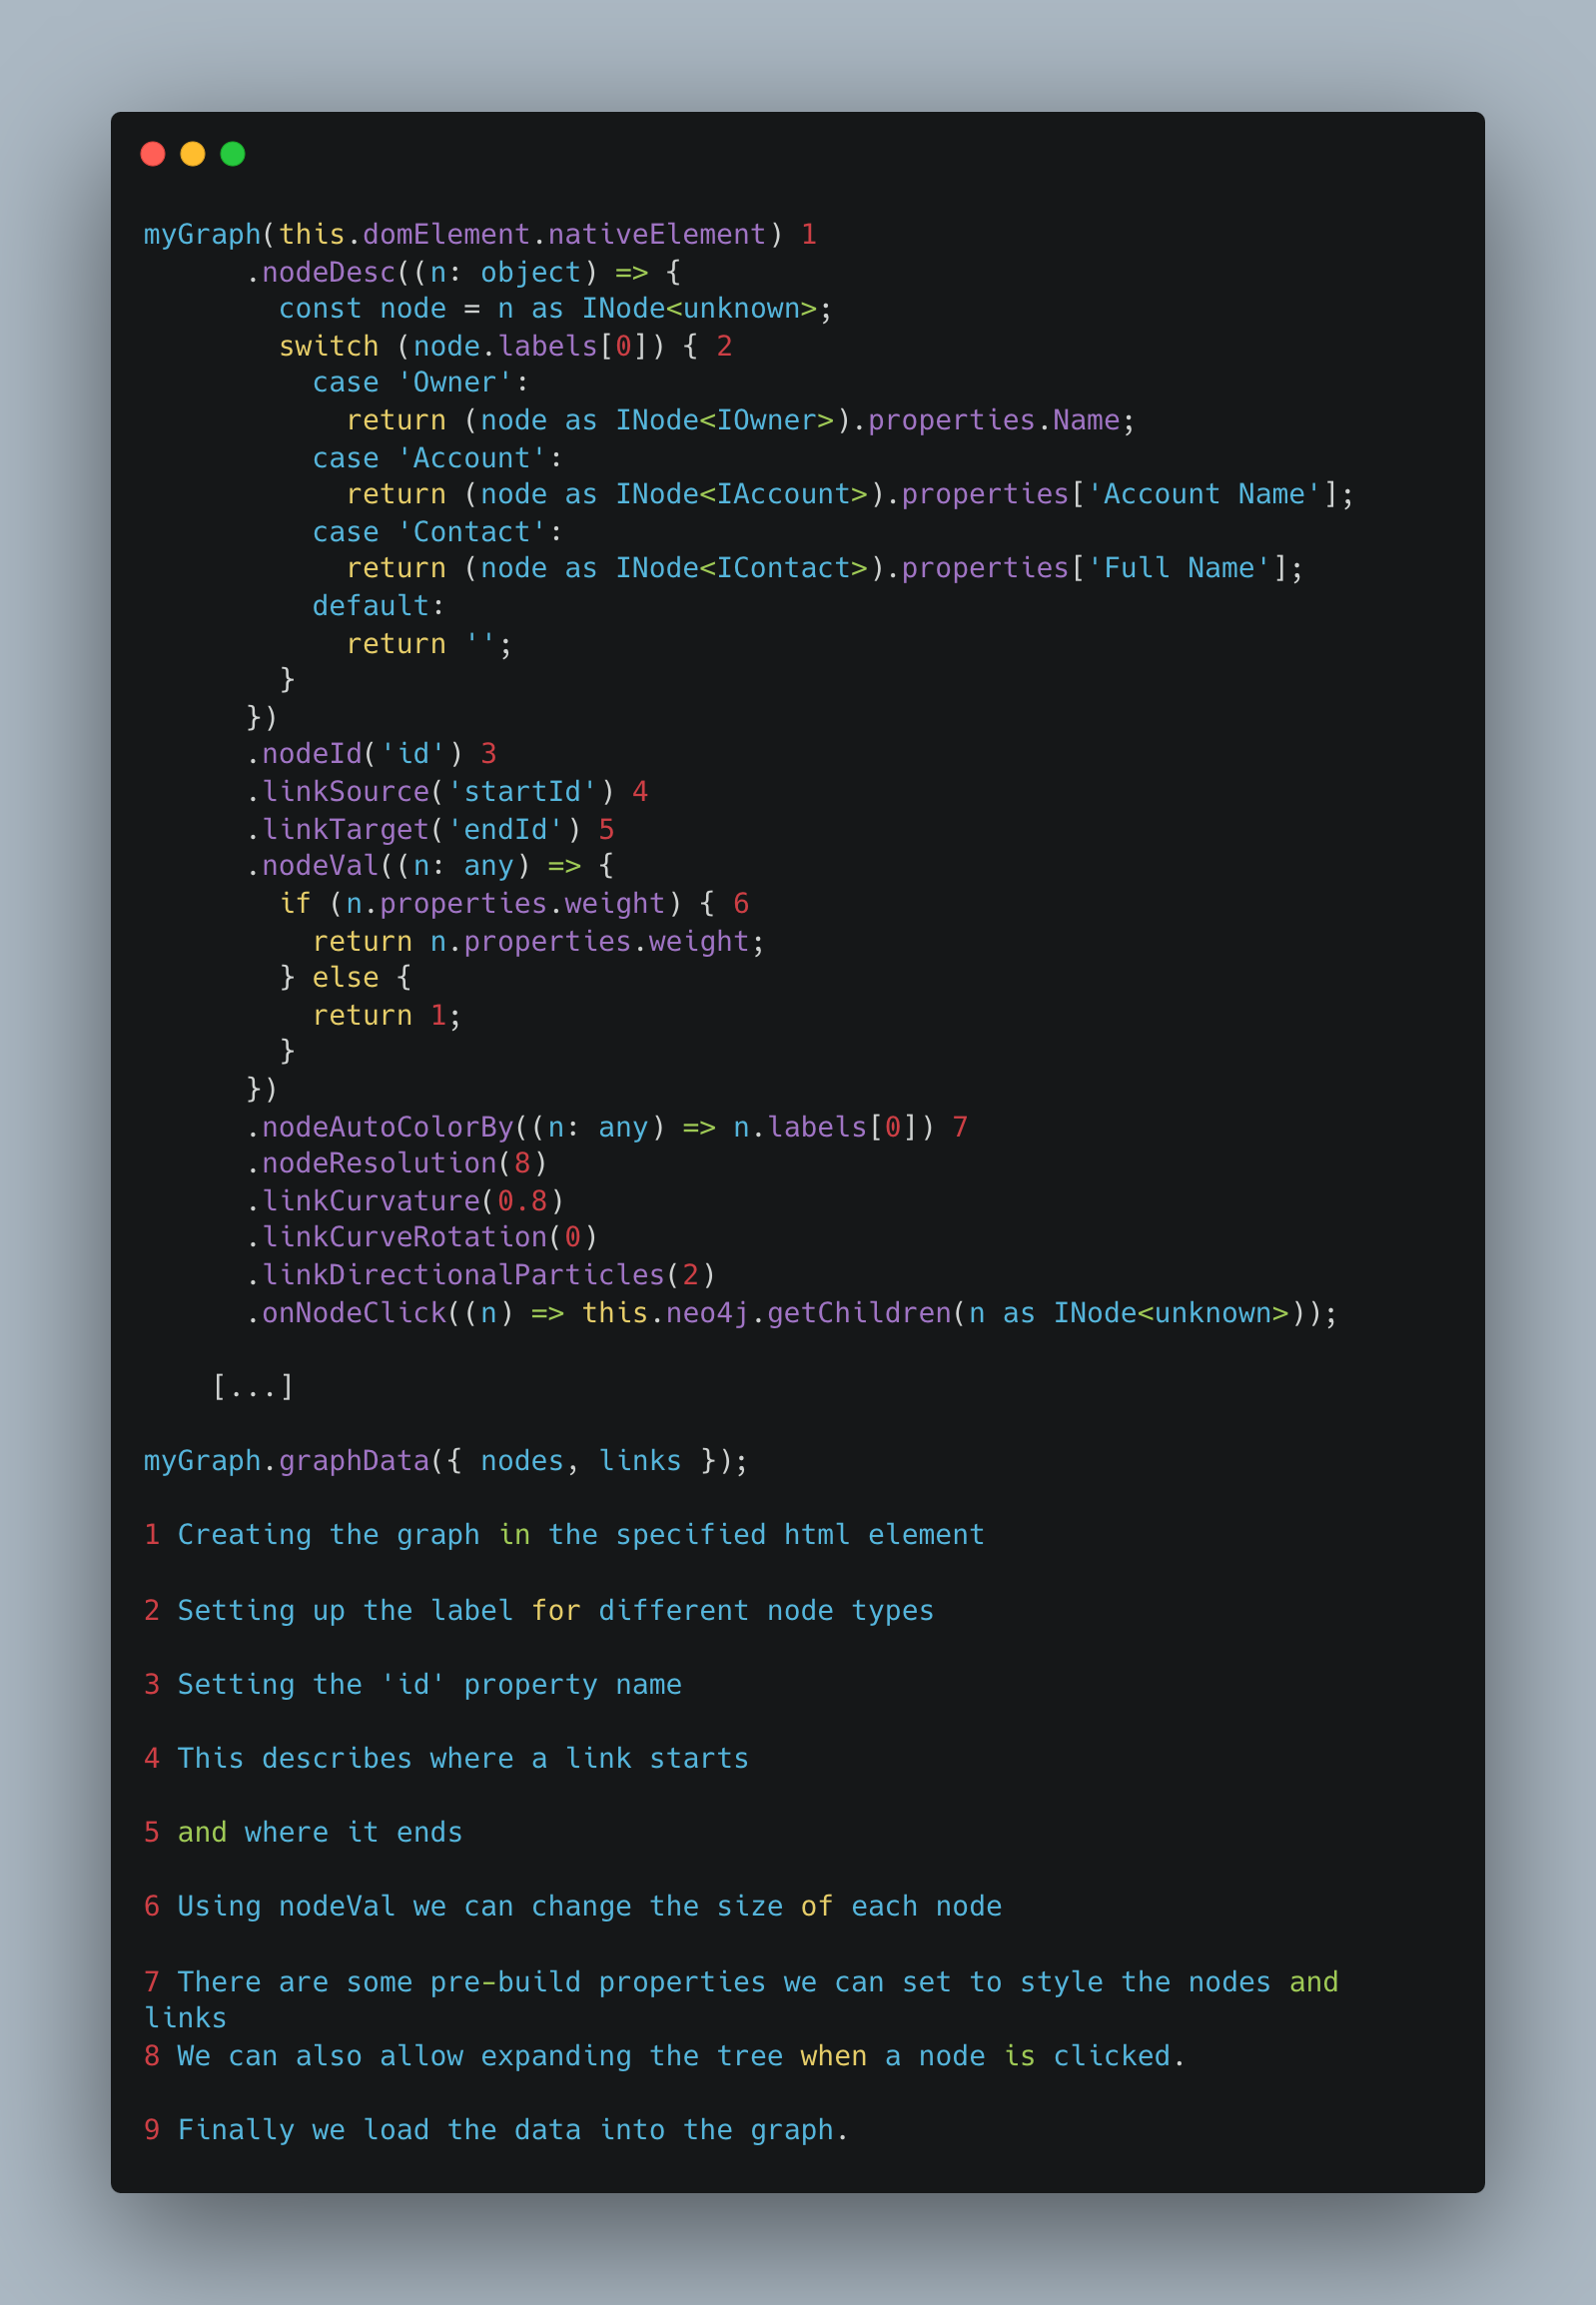
Setting up the graph

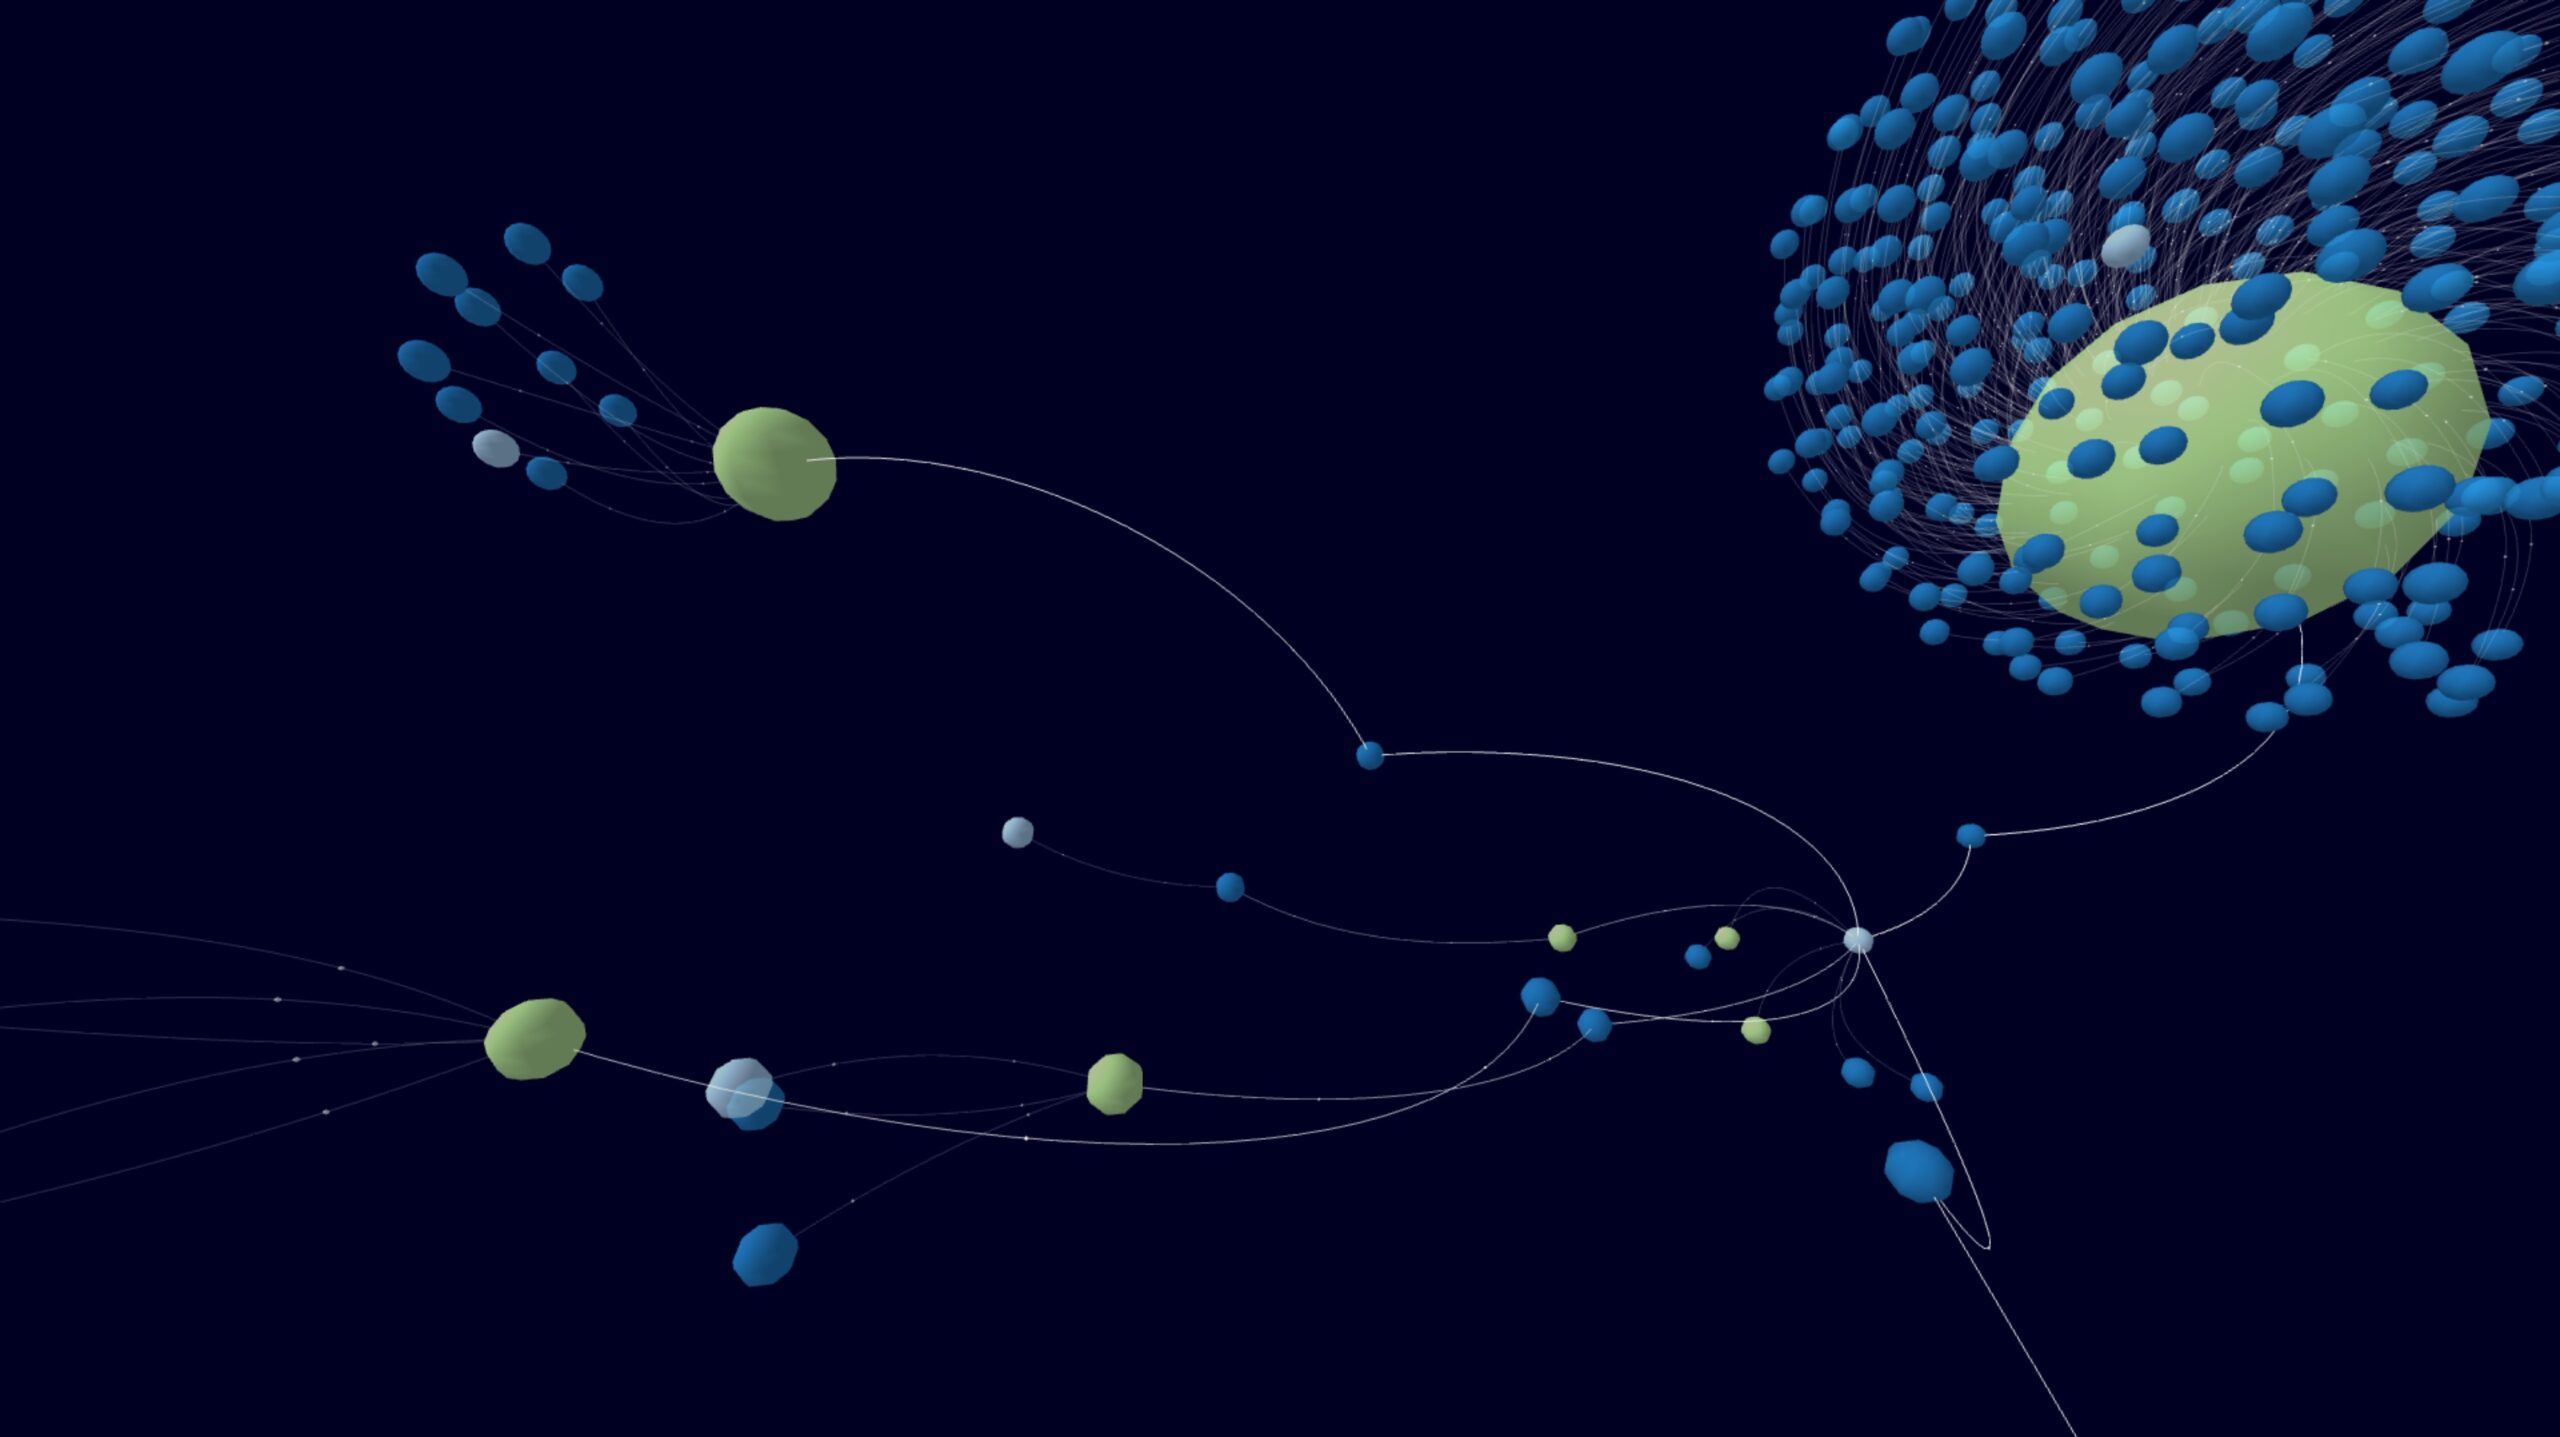
And with that we have a basic graph visualization. It has not many features, but it is a quick way to get started and experiment with the concept. As we later found out, this is ultimately not the best way to create a VR application, but it allowed us to quickly prototype our visualization and test it on a desktop computer.
 While the application was developed without mayor hurdles getting it to run on the headset involved some tinkering. This is because Web-VR applications only work over a HTTPS connection. As we were on a tight schedule during our Hackathon we decided to just use a self signed certificate and a simple express web-services. This not only allowed us to use the application on the headset, but also reduced the amount of data needing to be transferred, as we were able to use server-side data manipulation to achieve the format required by the graph library.
Limitations and Challenges
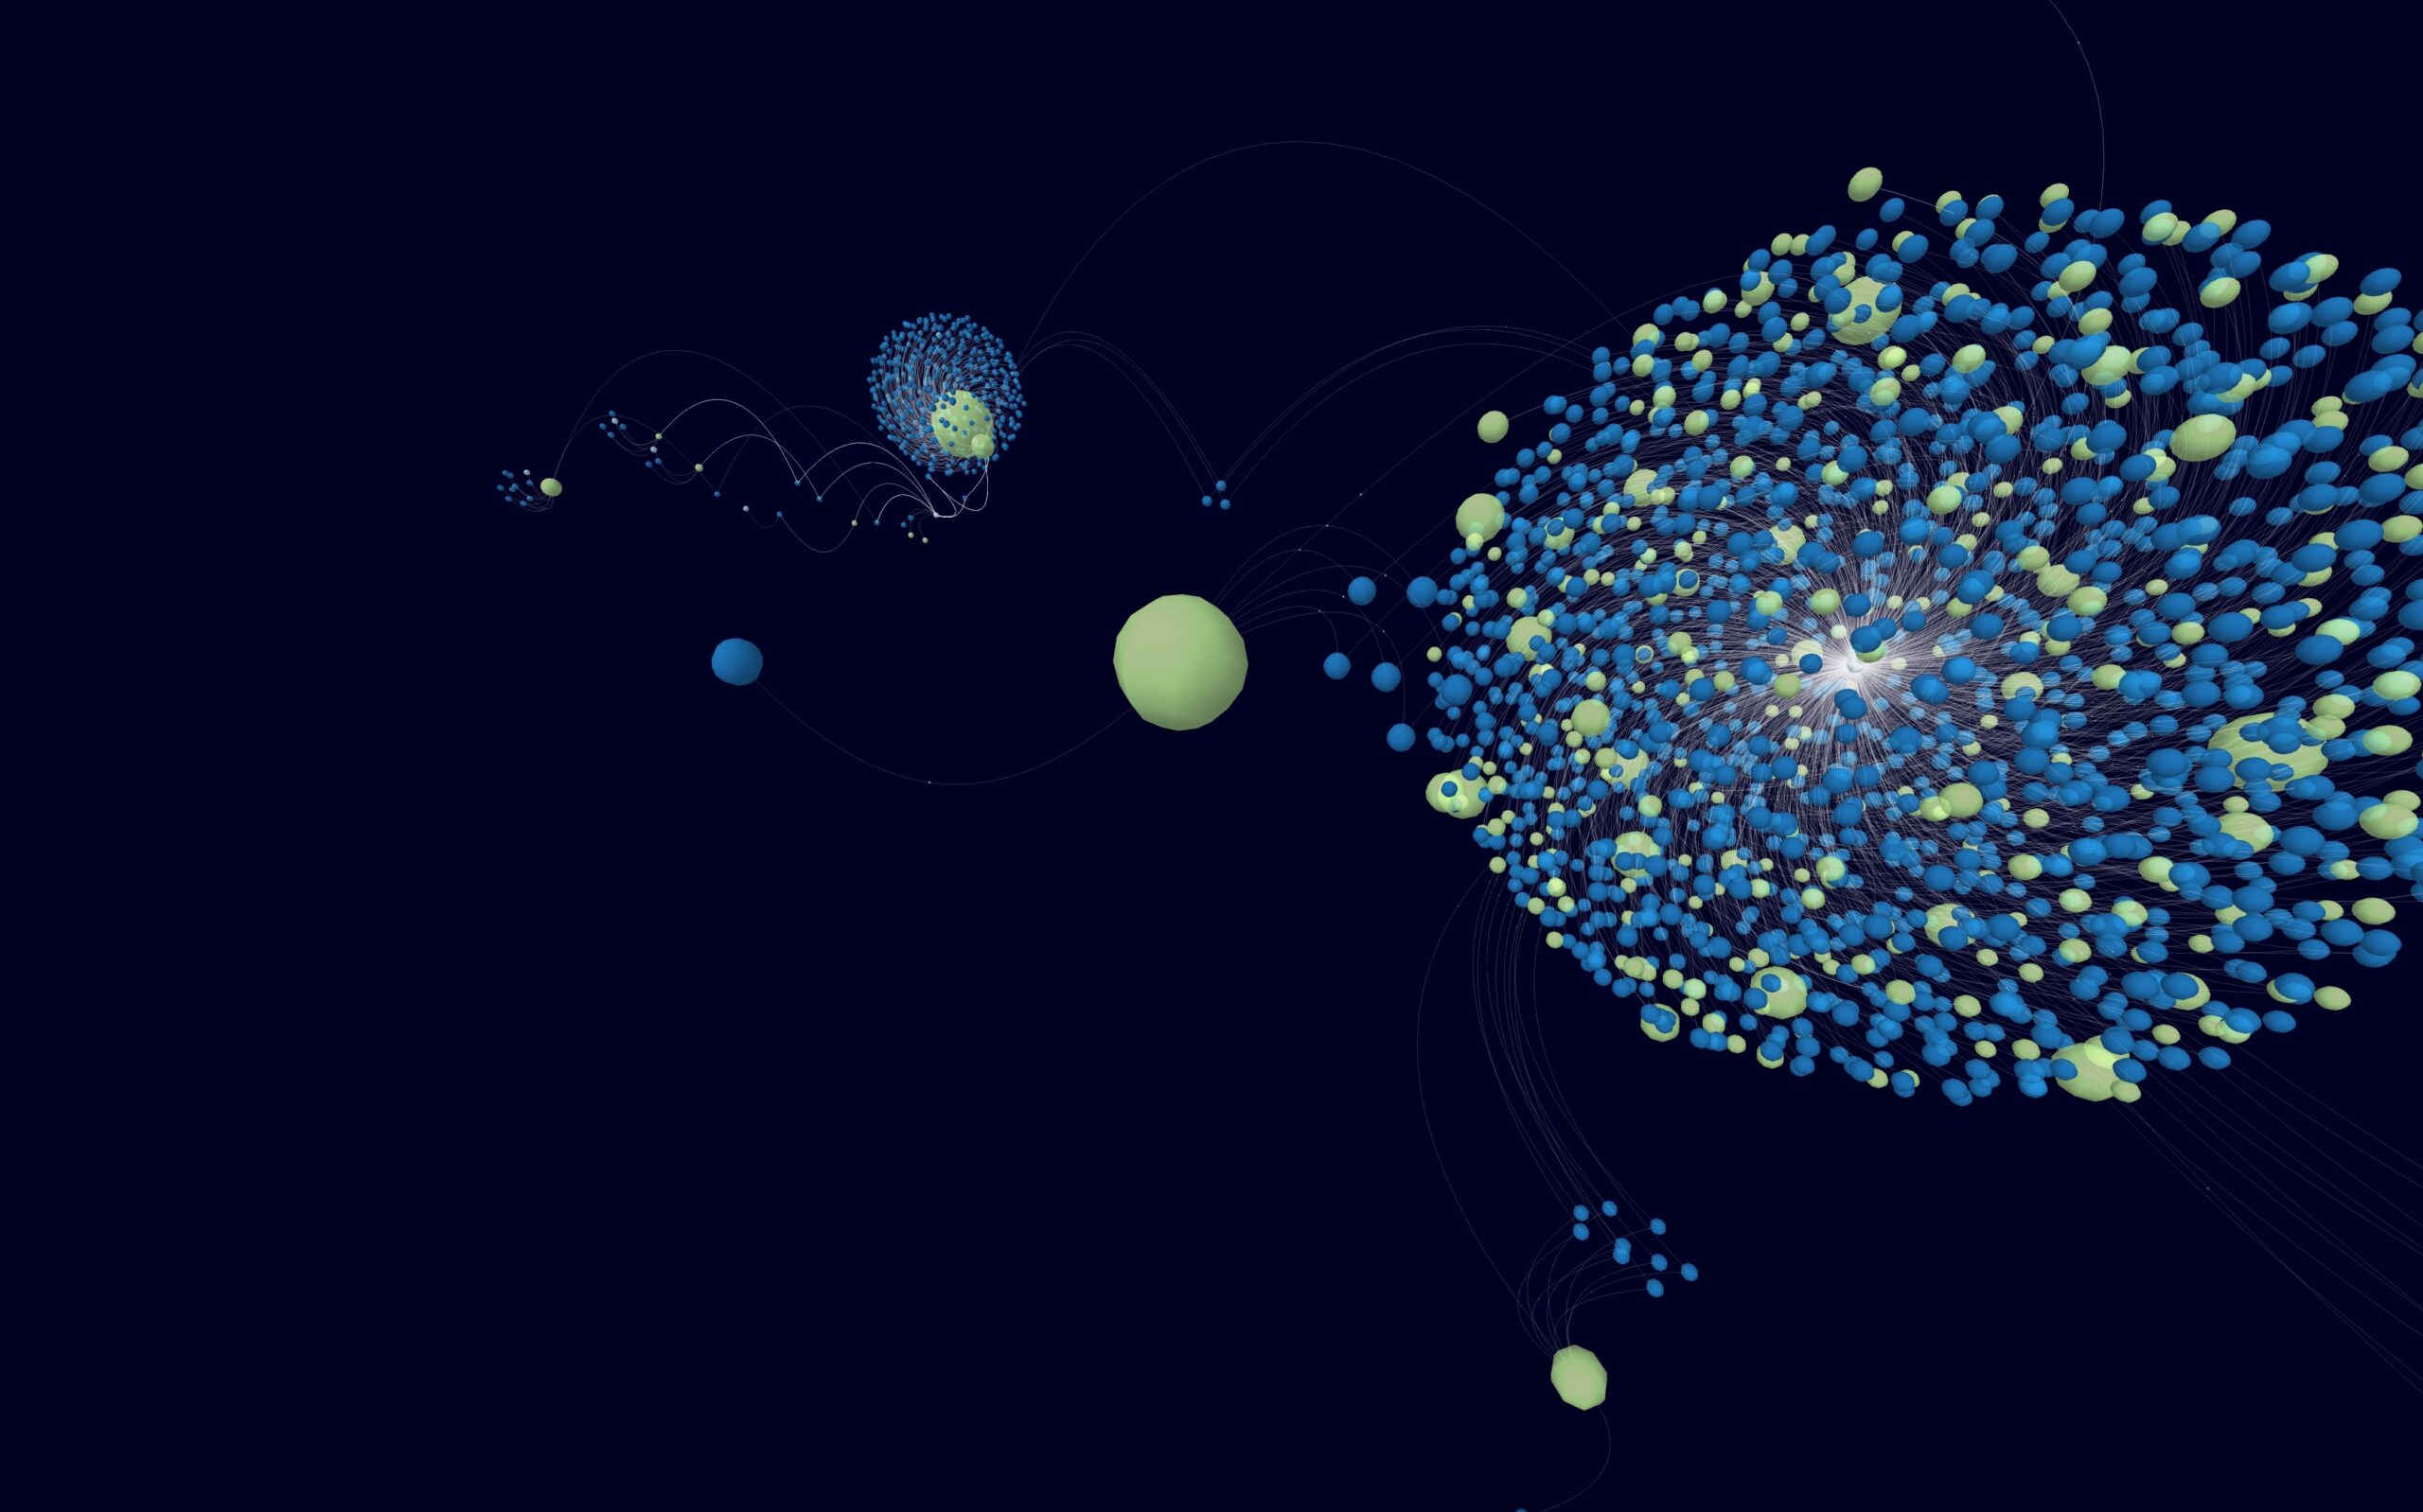
While this approach allowed us to quickly prototype our visualization, it also had some limitations. For example, we were not able to use the full capabilities of the VR headset, such as the ability to interact with objects in the environment. In addition to that, we were limited by the performance of the browser and VR Headset, which meant that we could not render as many objects as we would have liked to.
Using a native or more customized approach would have allowed us to overcome these limitations, but would have required more time and effort to implement.
 Another challenge is the accessibility and affordability of VR technology. Although VR headsets have become more affordable in recent years (e.g. Quest 2 / Pico), widespread adoption and availability are still limited. As technology advances and becomes more accessible, the barriers to entry for VR data visualization will diminish, opening up new opportunities for businesses and individuals to harness the power of VR. This still needs to be balanced with the performance requirements of the application, as standalone headsets are usually not as powerful as a desktop computer.
As VR technology continues to evolve, we can expect exciting advancements that will further enhance the capabilities of data visualization. Staying informed about the latest developments and advancements in both hardware and software will be essential to leverage the full potential of VR data visualization and unlock deeper insights into our data.
Conclusion and Recommendations
Having the ability to visualize data in VR is a powerful tool that can help us make sense of complex datasets. While there are still some limitations to this approach, it has the potential to revolutionize how we interact with information and gain deeper insights into our data.
To make the most of VR data visualization, it is recommended to consider the specific needs of your use case. While web-based frameworks and tools provide a quick and accessible way to prototype VR visualizations, they may not be suitable for all scenarios. If your visualization requires advanced interactions or rendering of complex scenes, exploring native or customized approaches may be more appropriate. Additionally, understanding the performance limitations of browsers and VR headsets is crucial when working with large datasets.
Despite these considerations, our prototype demonstrated the value of VR data visualization by providing new perspectives and insights that traditional 2D visualizations often cannot deliver. Businesses, organizations, and individuals should consider incorporating VR data visualization into their analytics toolkit to drive more effective data-driven decision-making, foster collaboration, and enhance communication with stakeholders.


0 Comments